This tutorial can be downloaded link.
2.0 Plot Density of States
We are going to plot the electronic density of states.
Step 1: Load westpy
[1]:
from westpy import *
 _    _ _____ _____ _____
| |  | |  ___/  ___|_   _|
| |  | | |__ \ `--.  | |_ __  _   _
| |/\| |  __| `--. \ | | '_ \| | | |
\  /\  / |___/\__/ / | | |_) | |_| |
 \/  \/\____/\____/  \_/ .__/ \__, |
                       | |     __/ |
                       |_|    |___/

WEST version     :  3.1.1
Today            :  2018-09-19 15:22:31.298822
Step 2: Electronic Structure
[2]:
es = ElectronicStructure()
We add keys that will be used to browse the electronic structure.
[3]:
es.addKey("eks","Kohn-Sham energy (eV)")
es.addKey("eqp","Quasiparticle energy (eV)")
We add three data points.
[4]:
es.addDataPoint([1,1,1],"eks",-4.6789)
es.addDataPoint([1,1,2],"eks",-4.3789)
es.addDataPoint([1,1,1],"eqp",-4.5789)
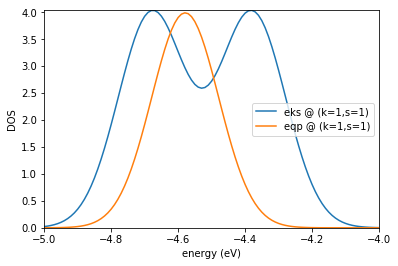
We can plot the DOS for both the key “eks” and “eqp”
[5]:
%matplotlib inline
es.plotDOS(kk=[1],ss=[1],energyKeys=["eks","eqp"],energyRange=[-5,-4,0.01])
Requested (emin,emax) :  -5 -4
Detected  (emin,emax) :  -4.6789 -4.3789
output written in :  dos.png
waiting for user to close image preview...

[ ]: